Wastewater Treatment Plant image

Energy benchmarking is an effective and convenient approach to tracking and analyzing energy use of a water treatment plant (WTP) or wastewater treatment plant (WWTP) over time. An energy baseline provides treatment plants with a picture of how much energy the facility consumes. Benchmarking your plant provides metrics for comparing performance against similar facilities, as well as tracking your facility’s performance over time. Benchmarking against other facilities can reveal the relative availability of energy savings opportunities. Interior tracking of performance can be used to show progress toward efficiency goals, the impact of projects and operational changes, and reveal when systems are drifting away from design operation.

Data required for energy benchmarking

To create an energy benchmark or baseline, it is important that publicly owned treatment systems consistently monitor energy consumption over time. The easiest source for energy data is a plant’s monthly utility bills. We recommend accessing at least two years of utility data to create an energy benchmark. Since most operators do not have direct access to utility data, it is recommended that operators and budget officials, such as the municipal clerk or treasurer, work together to monitor facility data. A simple spreadsheet can be shared monthly between the treatment plant and budget offices to log and track utility use over time.

Once utility bills have been gathered, water treatment plants will want to review their monthly operating reports (MORs) to match monthly plant treated flows with monthly utility consumption. For wastewater plants, operators will want to collect monthly influent flows and compare the difference between influent and effluent biological oxygen demand (BOD) from their discharge monitoring reports (DMRs) with their utility data.

Benchmarking analysis

An energy benchmark is developed by using at least two years of utility data to calculate an average energy use intensity for the plant. Water treatment, for instance, commonly benchmarks energy usage using kilowatt hours (kWh) per Million Gallons (MG), an energy intensity per unit flow. Wastewater treatment plants have two benchmarks, a kWh/MG flow and kWh/lb-BOD removed loading benchmark.

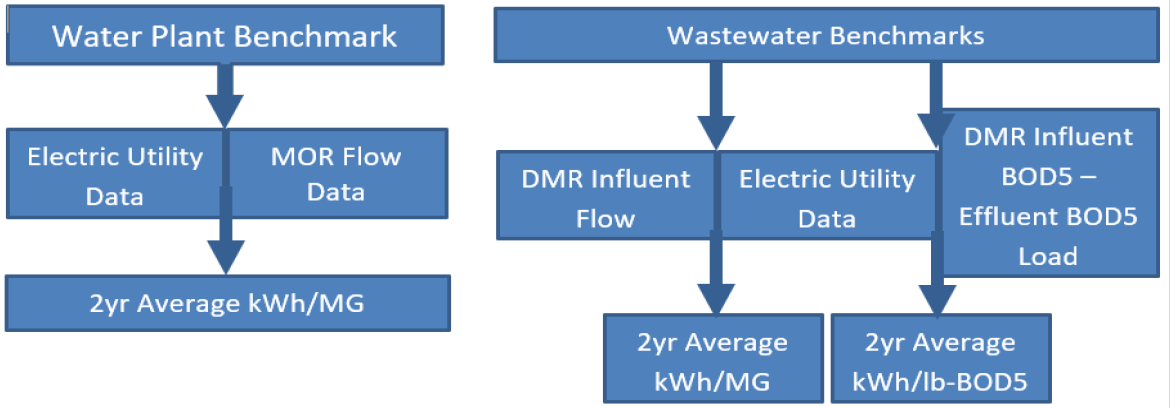
Flow-Based Benchmark: A flow-based benchmark is the most simple and common benchmarking measure for water facilities. It provides a general overview of a treatment plant’s energy performance per volume of water or wastewater treated. For water treatment plants, this is relatively direct efficiency metric since pumping water is 70-90% of a water plant’s energy use. However, a flow-based benchmark may not fully capture process efficiency for wastewater plants. This is because treatment, such as aeration, is not always directly correlated with treated water flows. Therefore, a flow benchmark can fail to capture energy use for nutrient treatment processes.

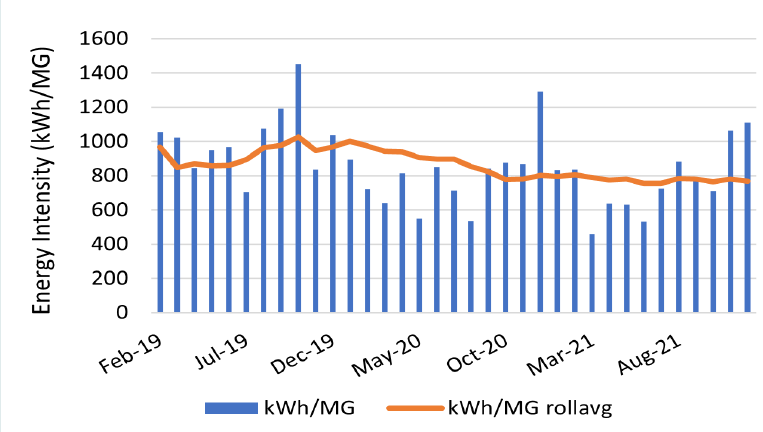
Load-Based Benchmark: A load benchmark, such as kWh/lb-BOD removed, can better capture the efficiency of the treatment process, but does not capture energy use for pumping very well. Using both a flow and load based benchmark can show a complete picture of energy use across all facility processes. To start the benchmarking process, list two years of utility data in a spreadsheet. Then, add flow or load, alongside each month’s energy use. This will set up your benchmarking table to normalize your plant’s energy use according to your facility treatment characteristics. After this is complete, add up the energy (kWh), cost, and flow information respectively to display totals for the two-year period. Finally, divide those numbers by two to get an average yearly energy usage for your facility. Using this information, you can also create a graph of performance over time to visualize facility performance, such as the one below.

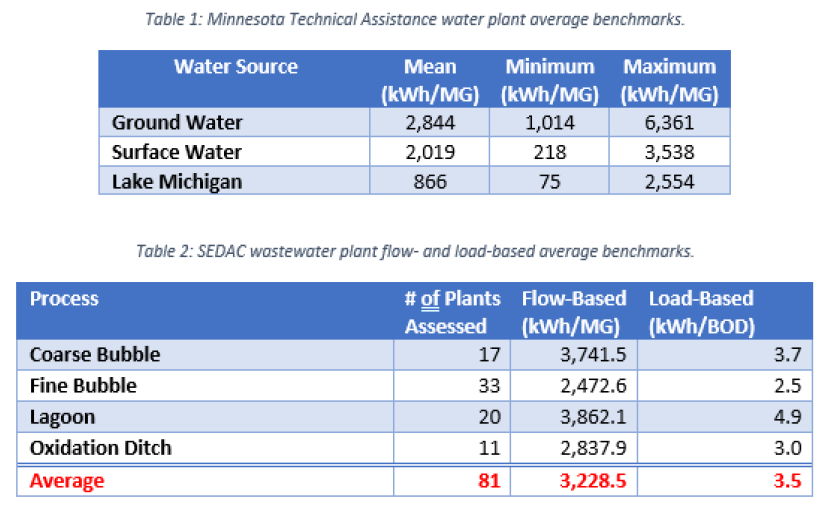
There are a variety of tools to compare your plant’s energy usage with other similar facilities, many of which are highlighted below. Based on past Illinois EPA Public Water Infrastructure Energy Assessment Program client data, we’ve created an average baseline for water and wastewater treatment plants. Similar benchmarks have been found by the Minnesota Technical Assistance Program based on local plant information. Tables 1 and 2 below summarize benchmarks for water and wastewater facilities.

Higher benchmarks than average suggest a plant with easier savings opportunities. There are likely to be low-cost improvements with quick returns on investment. While lower values suggest a more efficient treatment process, it also indicates that a facility is likely to require more time and capital to achieve better performance.


The values are simple references, as they do not account for specific equipment used or type of process in different facilities. More detailed benchmarks can be obtained with the use of ENERGY STAR Portfolio Manager or other analysis tools covered below, but these take more in-depth information gathering than the simple benchmarks above.

Considerations and Tools

Benchmarking a plant over time is a straightforward process that can track the performance of a facility year over year. When comparing to other facilities, however, benchmarking becomes more complicated. For example, comparing a lagoon plant to data from activated sludge plants will not likely reveal useful comparisons, as lagoon plants often are much simpler and less energy intensive than activated sludge systems. Three of the widely used tools are listed below:

  1. EPA ENERGY STAR Portfolio Manager. This tool allows users to track and assess energy and water use at individual sites and across portfolios of facilities. It uses input information to calculate a 1-100 percentile ranking, which allows facilities to compare energy performance against peers participating in the program. The 75th percentile or greater is recognized as high efficiency, where the 50th percentile would be average. The percentile score is based on input data such as influent flow, BOD levels, load factor, type of aeration and nutrient removal technologies, and weather. In addition to calculating the score, ENERGY STAR Portfolio Manager can track energy performance over time.
  2. EPA Energy Assessment Tool (EAT). EAT is a spreadsheet-based tool that develops metrics for energy efficiency and energy savings. Facilities can develop absolute, flow-normalized, and load-normalized energy intensities.
  3. DOE Energy Performance Indicator (EnPI) Tools: The EnPI is a regression analysis tool developed by the DOE to establish a normalized baseline of energy consumption and track annual progress in energy intensity improvement and energy savings. This tool differs from ENERGY STAR Portfolio Manager in that it offers the flexibility to include more measures that may impact a plant’s energy use. It generates several energy regression models based on inputs, and it highlights regressions with the greatest statistical validity. Outputs include energy performance improvement (in percentage terms), annual and total energy savings. Although regression analysis is an important feature of EnPI, the tool also allows users to calculate performance using simpler energy intensity metrics, such as BTU/MG and Btu/lb-BOD removed.

Identifying Performance or Operational Issues

A key use for energy benchmarking is tracking performance over time. Knowing how your plant compares to others can give you an idea of the level of efficiency gain you can obtain. However, tracking your facility energy use over time can arguably be more beneficial, since your benchmark is related to your equipment and processes. Increases in energy use month-to-month or year-to-year can indicate loss of efficiency in existing systems and hidden maintenance needs. Operators can observe these changes by simply analyzing the energy intensity for a given period as demonstrated in the figure below.

As plants implement energy efficiency improvements, tracking energy data and benchmarking year to year can encourage more innovation at the plant and support future energy efficiency upgrades. Operators, staff, and management can visually see efficiency gains or losses and monitor whether an upgrade is working as intended. For example, benchmarking can be used to track lift station VFD improvements to see whether the technology has increased or decreased energy use. Settings can then be optimized and maintain the intended efficiency gains.

Conclusion

The aim of energy benchmarking is to measure and compare performance to identify best practices for driving energy efficient processes. In other words, benchmarking answers the following questions: how much energy is a plant using, and how well is it being used in comparison with other plants and against benchmarks for energy efficient treatment? There are plenty of guides and resources available at the websites below. Start benchmarking energy use now for your facility to understand how your energy reduction efforts impact your plant now and in the future.